Curve Sketching With Derivatives: First and Second Derivative Tests
Sketch any curve with derivatives: increasing and decreasing intervals, local extrema, concavity, inflection points and a full cubic worked example.
By the PracticeCalculus team Published 7 min read
On this page
- What the first and second derivatives tell you
- The first derivative test
- The second derivative test
- Worked example 1: a full sketch of a cubic
- Worked example 2: when the second derivative test fails
- Worked example 3: an exponential curve
- Common mistakes in curve sketching
- Quick reference
- Practice reading graphs from derivatives
A graphing calculator draws a curve in a second, so why sketch by hand? Because the calculator does not tell you why the curve looks that way, where exactly it turns, or whether a wiggle off-screen is hiding a maximum. Derivatives answer all of that. With f' and f'' you can predict the exact shape of a graph before plotting a single point, and exam questions on this are some of the most predictable points you can earn.
What the first and second derivatives tell you
Curve sketching means using derivatives to find where a graph rises and falls, where it turns, and how it bends. Each derivative answers one question:
- The first derivative f' is the slope. Where f'(x) > 0 the function is increasing; where f'(x) < 0 it is decreasing.
- The second derivative f'' is the rate of change of the slope. Where f''(x) > 0 the graph is concave up (shaped like a cup); where f''(x) < 0 it is concave down (shaped like a cap).
A critical point is an x in the domain where f'(x) = 0 or f'(x) does not exist. These are the only places a smooth function can turn around. An inflection point is a point on the graph where the concavity changes.
The first derivative test
Let c be a critical point. Check the sign of f' just to the left and just to the right of c:
If f' has the same sign on both sides, there is no extremum at c: the graph just flattens briefly and carries on.
The reason is simple. A local maximum is where the graph stops going up and starts going down, so the slope must switch from positive to negative.
The second derivative test
If f'(c) = 0, you can often skip the sign chart and evaluate f''(c):
A flat tangent on a curve that is concave down must be the top of a hill; a flat tangent on a cup must be the bottom. But if f''(c) = 0, the test is inconclusive. It does not mean "no extremum." Go back to the first derivative test.
Worked example 1: a full sketch of a cubic
Sketch f(x) = x^3 - 3x^2 - 9x + 5.
Step 1. Domain and intercepts. A polynomial is defined for all real x. The y-intercept is f(0) = 5.
Step 2. First derivative and critical points.
So f'(x) = 0 at x = -1 and x = 3.
Step 3. Sign chart for f'. Test one value in each interval:
| Interval | Test value | f'(x) | Behavior of f |
|---|---|---|---|
| (-\infty, -1) | x = -2 | 3(-5)(-1) = 15 > 0 | increasing |
| (-1, 3) | x = 0 | 3(-3)(1) = -9 < 0 | decreasing |
| (3, \infty) | x = 4 | 3(1)(5) = 15 > 0 | increasing |
By the first derivative test, f has a local max at x = -1 (plus to minus) and a local min at x = 3 (minus to plus).
Step 4. Heights of the turning points.
Step 5. Second derivative and concavity.
f''(x) < 0 for x < 1 (concave down) and f''(x) > 0 for x > 1 (concave up). Concavity changes at x = 1, so there is an inflection point at (1, f(1)) = (1, 1 - 3 - 9 + 5) = (1, -6).
Step 6. Confirm with the second derivative test. f''(-1) = -12 < 0, so x = -1 is a max. f''(3) = 12 > 0, so x = 3 is a min. Both agree with step 3.
Step 7. End behavior. The leading term x^3 dominates, so f(x) \to -\infty as x \to -\infty and f(x) \to \infty as x \to \infty.
Step 8. Sketch. Come up from the lower left, curving like a cap, peak at (-1, 10), pass through (0, 5), fall through the inflection point (1, -6) where the bend switches to a cup, bottom out at (3, -22), and rise to the upper right.
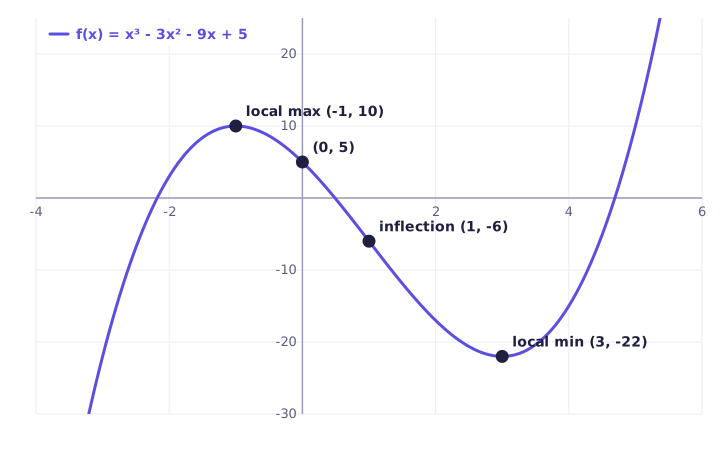
Notice the inflection point sits exactly halfway between the two turning points. That is true for every cubic with two critical points, and it is a handy check.
Worked example 2: when the second derivative test fails
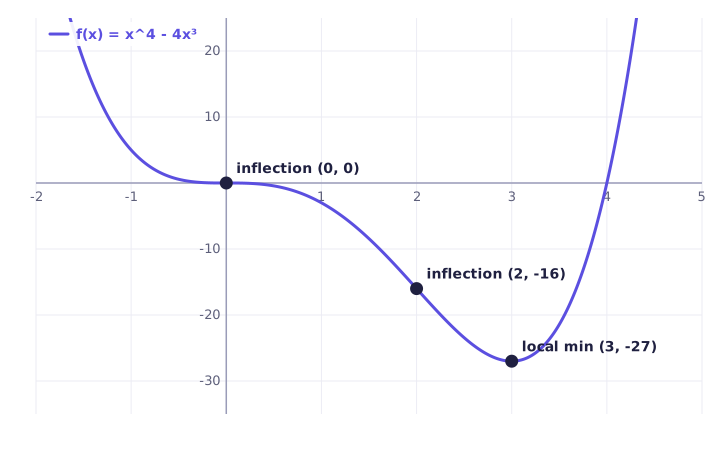
Analyze f(x) = x^4 - 4x^3.
Step 1. Critical points.
Critical points: x = 0 and x = 3.
Step 2. Try the second derivative test.
At x = 3: f''(3) = 12(3)(1) = 36 > 0, so there is a local min at (3, 81 - 108) = (3, -27).
At x = 0: f''(0) = 0. The test is inconclusive.
Step 3. Use the first derivative test at x = 0. The factor 4x^2 is never negative, so the sign of f' near 0 comes from x - 3, which is negative on both sides of 0. So f' is negative on both sides: f is decreasing through x = 0, and there is no extremum there, just a flat spot.
Step 4. Concavity and inflection points. f'' = 12x(x - 2) changes sign at x = 0 and x = 2:
| Interval | Sign of f'' | Concavity |
|---|---|---|
| (-\infty, 0) | + | concave up |
| (0, 2) | - | concave down |
| (2, \infty) | + | concave up |
Both are inflection points: (0, 0) and (2, 16 - 32) = (2, -16). So the flat spot at the origin is also an inflection point, which is why it is not a max or min.
Worked example 3: an exponential curve
Analyze f(x) = x e^{-x}.
Step 1. First derivative (product rule):
Since e^{-x} > 0, the sign of f' is the sign of 1 - x: increasing for x < 1, decreasing for x > 1. Local max at \left(1, \frac{1}{e}\right) \approx (1, 0.37).
Step 2. Second derivative.
Concave down for x < 2, concave up for x > 2. Inflection point at \left(2, \frac{2}{e^2}\right) \approx (2, 0.27).
Step 3. Second derivative test check. f''(1) = e^{-1}(-1) < 0, confirming the max.
As x \to \infty, e^{-x} shrinks much faster than x grows, so the curve levels off toward 0 (see limits at infinity).
Common mistakes in curve sketching
- Calling every f''(c) = 0 an inflection point. f(x) = x^4 has f''(0) = 0 but is concave up everywhere. Check that the sign changes.
- Concluding "no extremum" when the second derivative test fails. f''(c) = 0 means "use another test," not "nothing happens here." For x^4, x = 0 is a minimum.
- Mixing up which derivative does what. f' gives increasing/decreasing; f'' gives concavity. A function can be increasing and concave down at the same time.
- Testing signs at the critical points themselves. Pick test values strictly inside each interval.
- Reporting only x-values. A local max is a point. Give (-1, 10), not just x = -1, unless the question asks for location only.
- Forgetting points where f' is undefined. For f(x) = x^{2/3}, f'(0) does not exist, yet x = 0 is a minimum (a sharp cusp).
Quick reference
| You find | Condition | Meaning |
|---|---|---|
| Increasing | f'(x) > 0 | graph rises left to right |
| Decreasing | f'(x) < 0 | graph falls left to right |
| Critical point | f'(c) = 0 or undefined | candidate for max or min |
| Local max | f': + \to -, or f''(c) < 0 | top of a hill |
| Local min | f': - \to +, or f''(c) > 0 | bottom of a valley |
| Concave up | f''(x) > 0 | bends like a cup |
| Concave down | f''(x) < 0 | bends like a cap |
| Inflection point | f'' changes sign | bend switches direction |
For finding the absolute biggest or smallest value of a real quantity, the same tools power optimization problems.
Practice reading graphs from derivatives
Curve sketching is a routine: critical points, sign chart, second derivative, sign chart, sketch. The routine becomes fast only with repetition. The interactive lesson below lets you practice concavity and the second derivative with instant feedback, so you build the habit of checking for a sign change before calling something an inflection point.
Practice it now
Concavity and the second derivative
Solve real problems on this topic with instant feedback, hints and a step-by-step walkthrough for every answer. Free, no sign-up needed to start.
Practice this lesson